“Wow, you must really like writing!”
“Oh, you must be a good writer!”
“So, are you going to be on TV?”
—————-
These are just a few of the reactions I’ve gotten when I tell people I came to the U.S. to study journalism. It’s true, I do love to write; and at a certain point in my college career, I did want to be a TV reporter. But about this time last year, when I was getting ready to graduate with my bachelor’s degree, I decided to steer my career into a different path.
Flash forward to today, a couple internships later, and a whole lot of figuring things out and learning on the job, I’m interning as a news apps designer for the NPR visuals team, while actively looking for full-time opportunities in data and graphics journalism.
So, how did you get here?
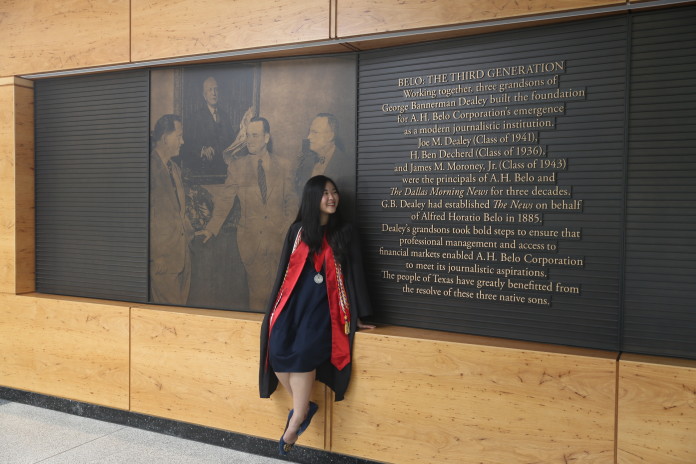
First, a little bit of background about myself: I grew up in Jakarta and I came to Austin, Texas in 2016 to pursue a bachelor’s degree at the University of Texas at Austin. I chose journalism as a major because I fell in love with storytelling and uncovering truths, and I found the profession to be a noble calling. In college, I wrote for the student newspaper, The Daily Texan, and that’s where I grew as a journalist.
One of my favorite stories that I wrote was on UT’s admission process and how students from the English Language Program aren’t given an advantage when it comes to the application process. I thought it would be cool to print the story along with a flowchart that explains the admission process. So I requested an infographic from the design team to go with the story. This was the first time I realized that visuals could make a story much more compelling.
During my senior year, I took a coding and data class within the journalism school, and they both completely changed my life. I loved both of these classes and felt like I was understanding the concepts pretty quickly. That semester, I also participated in a hackathon within the journalism school, where my team and I designed and coded an election results interactive map in 12 hours, despite having very minimal coding experiences.
But most importantly, I had a professor who was very much like a mentor. He brought me and a few other students to our first data journalism conference, and he introduced me to some of the people who ended up becoming my editors and colleagues.
Ok so, what is it exactly that you do?
Great question. The field I’m in has a lot of names — news apps, data journalism, graphics, design/dev, data visuals, etc. That’s because my dream job encompasses a little bit of everything on this list.
The way I like to describe what I do is that it’s a mix of design, data, coding and reporting. What that means is I do everything from helping reporters find data for their stories, to analyzing it, to designing and coding charts or maps. Sometimes, I also write my own data stories. I’ve done this for both my data visuals fellowship/internship — at the Texas Tribune and at NPR.

Some examples of my work –– I designed and coded the front-end of this election results page for the Texas Tribune. I also worked on graphics and data analysis for this story on homelessness in Texas and voter turnout. I’ve also worked on maps showing the spread of COVID-19 for NPR, and a story on coronavirus-related travel advisory.
That’s pretty cool! What are the takeaways you got from your super cool internships?
A lot! For starters, I came with almost no professional design or data vis experiences, and I learned so much on the job. I learned how to present data in a fair and accurate way and how to write about numbers in a way that won’t bore you to death. I also met some of the best reporters and editors in the industry and learned a lot from them. Some of the practical skills I learned are how to make graphics in Adobe Illustrator, how to use QGIS to make maps, how to write better HTML and CSS code and how to make charts in D3, a JavaScript library. I also learned the importance of checking your data and analysis several times and have someone else be your second pair of eyes, because accuracy is so important!
What are your future plans?
I’m actively looking for jobs right now as a data and graphics journalist. I’m flexible on where I want to live, but I’m really eyeing Singapore and Hong Kong because they’re such a strategic hub for news in Asia. But most importantly, I want to be in a job where I can still do a mix of design, data, coding and reporting. I can’t imagine myself doing anything else, and I certainly can’t imagine myself leaving journalism!


